Introduction to the Volume Price Trend (VPT) Indicator:
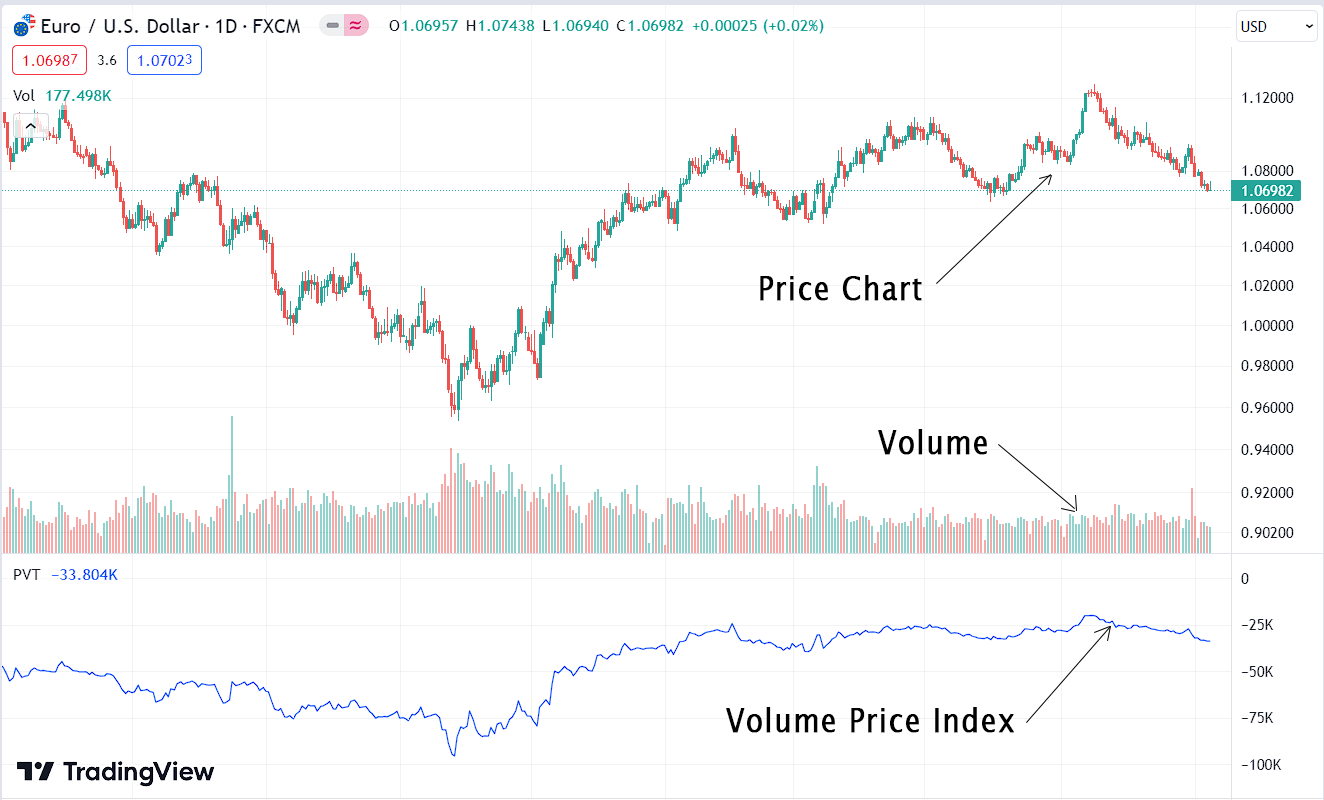
The Volume Price Trend (VPT) is a hybrid technical indicator that combines the price change and trading volume. It was developed by David M. Vomund in the late 1970s. In the following image, you can see how this indicator looks in Tradingview.
Calculating the Volume Price Trend – The Formula:
This indicator is calculated by adding up the value of volume multiplied by price change.
VPT = VPT Previous + Volume * Price Change
VPT = VPT Previous + (Volume * [(Closing Price – Closing Price Previous) / Closing Price Previous])
Now, let us take a look at an example calculation-
Suppose we have the following data for a stock:
- Day 1: Closing Price = $50, Volume = 100,000 shares
- Day 2: Closing Price = $52, Volume = 120,000 shares
- Day 3: Closing Price = $54, Volume = 150,000 shares
First, we need to calculate the VPT for Day 1, which is usually set to zero as there’s no previous data. So, VPT(1) = 0.
Next, we calculate VPT for Day 2:
VPT(2) = VPT(1) + (120,000 * [(52 – 50) / 50]) = 0 + (120,000 * [0.04]) = 4,800
Now, let’s calculate VPT for Day 3:
VPT(3) = VPT(2) + (150,000 * [(54 – 52) / 52]) = 4,800 + (150,000 * [0.0385]) ≈ 10,725
Interpreting the Volume Price Trend:
We are looking at the direction of the VPT indicator rather than its value. If the price of the asset decreases, the price change will be negative; therefore, VPT will decrease. Conversely, if the price of the asset increases, the price change will be positive, and VPT will increase.
Trading strategies with the VPT:
- Signal Line Crossover – We can apply a moving average to the VPT line as a signal line. If the VPT line crosses the signal line from below to above, this is considered a bullish signal. Conversely, if the VPT line crosses the signal line from above to below, it is considered a bearish signal.
- Spotting the Divergence – Divergence occurs when there is a disparity between the price chart and the indicator. This signals weakening of the current momentum and a potential trend reversal.
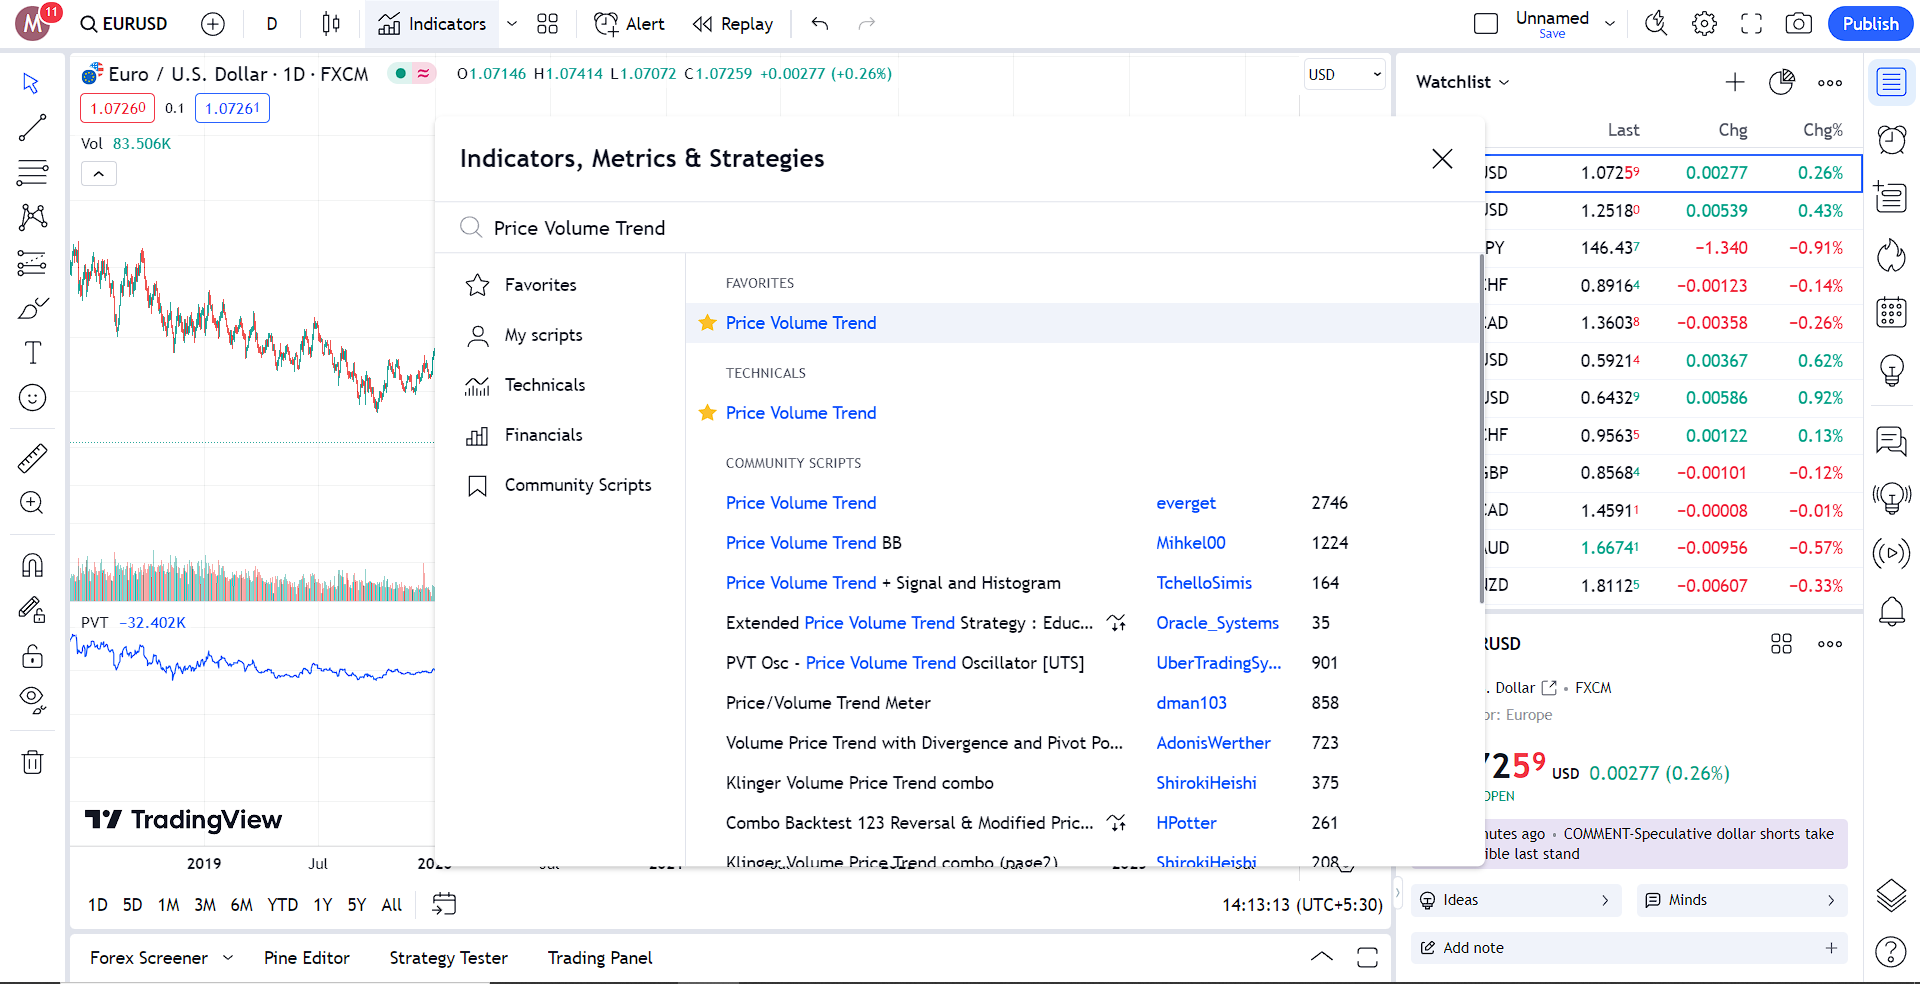
Using Volume Price Trend Indicator with the Trading View:
Goto Indicators , then search for ” Price Volume Trend”. Then click on the name of indicator to insert it into the chart.
Conclusion:
The Volume Price Trend (VPT) is a technical indicator calculated by multiplying the volume with the corresponding price change. If the price change is positive, the indicator will rise; if the price change is negative, the indicator will fall. It is important to keep in mind that signal line crossover signals are less reliable and often produce false signals. Therefore, never use this indicator alone to enter trades. Always confirm entries with other technical indicators or trading methods before placing a trade.
References:
https://en.wikipedia.org/wiki/Volume%E2%80%93price_trend
https://www.daytrading.com/volume-price-trend
Explore our Algorithmic Trading Courses: