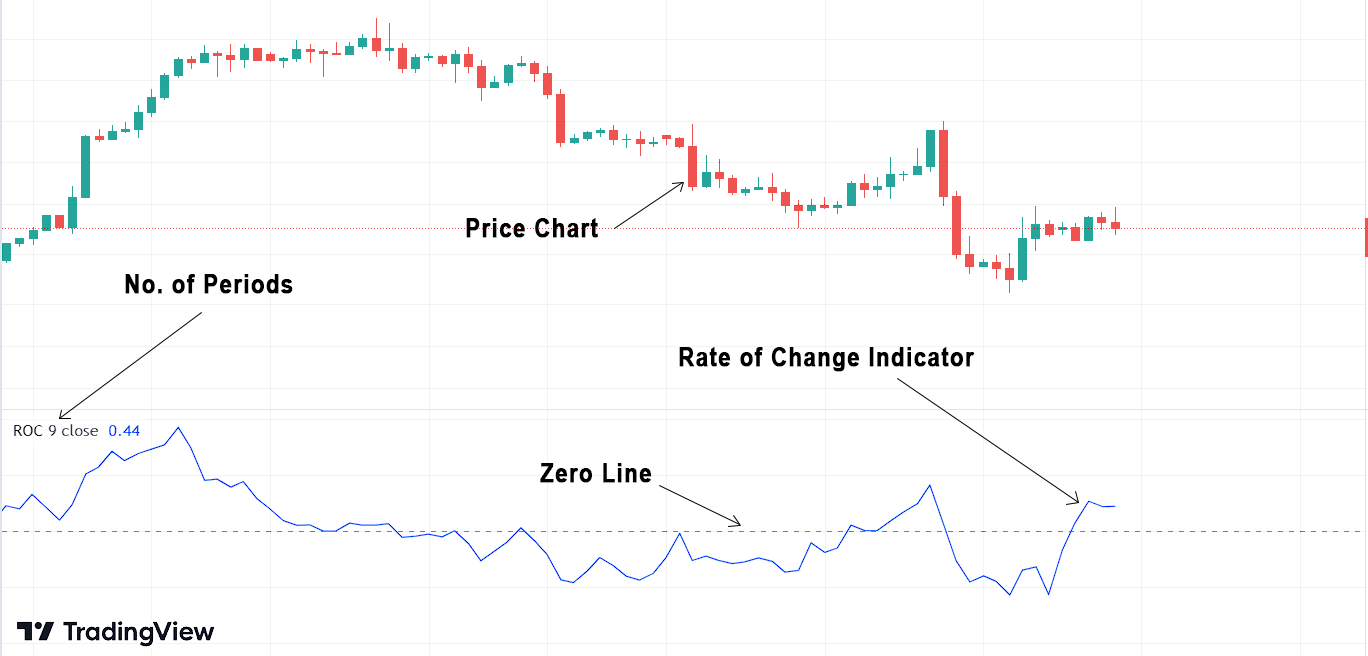
Introduction to Rate of Change Indicator (ROC):
The Rate of Change Indicator is a momentum oscillator that measures the percentage change in price compared to the price at a specific time ago, over a certain number of periods. This is a simple indicator containing a single line that fluctuates around zero, representing the percentage of price change. The ROC indicator does not have an upper boundary, but it does have a lower boundary of -100%, as the price can only drop up to 100%.
Calculating the Rate of Change Indicator (ROC): Formula:
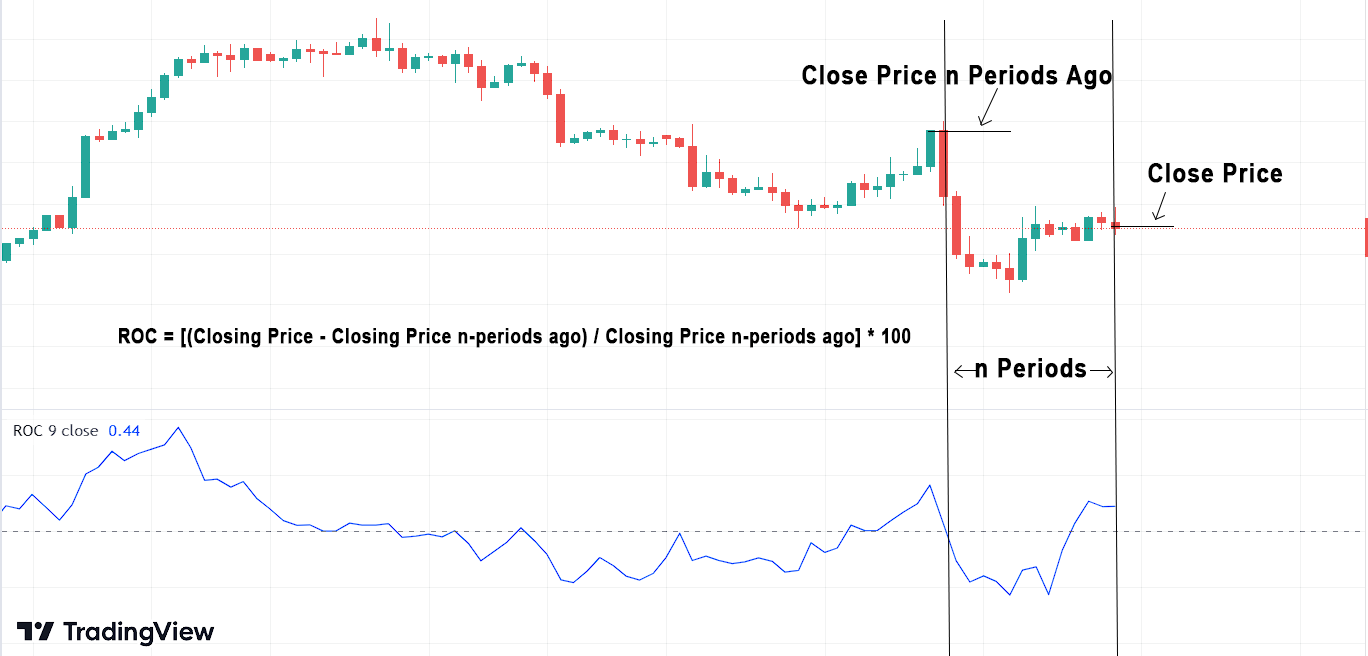
The ROC indicator measures the percentage change in price between the current closing price and the closing price n-periods ago. The formula for calculating ROC is relatively simple:
ROC = [(Closing Price – Closing Price n-periods ago) / Closing Price n-periods ago] * 100
Where:
- Closing Price is the most recent closing price of the asset.
- Closing Price n-periods ago refers to the closing price of the asset n periods back, where “n” is a user-defined parameter (e.g., 12, 14, or 20).
Now, let’s take a practical example to see how to calculate the 9-day ROC.
Example:
Let’s consider the daily closing prices of a hypothetical stock over the past nine trading days:
Day 1: $50, Day 2: $55, Day 3: $58, Day 4: $61, Day 5: $63, Day 6: $59, Day 7: $55, Day 8: $52, Day 9: $56
To calculate the 9-day ROC for Day 9, we apply the formula:
ROC = [($56 – $50) / $50] * 100
ROC = [$6 / $50] * 100
ROC = 12%
Interpretation of the Rate of Change Indicator (ROC):
If the indicator is above the zero line, it means that the current price of the asset is a certain percentage above the price n periods ago, indicating bullish momentum. On the other hand, if the indicator is below the zero line, it means that the current price of the asset is a certain percentage below the price n periods ago, indicating bearish momentum.
Trend Analysis with Rate of Change Indicator (ROC):
We can use this indicator to figure out the overall market trend. There are approximately 250 trading days in a year, 125 days per half-year, and 63 days per quarter. A trend reversal starts with the shortest timeframe and slowly affects the other timeframes. In general, the long-term trend is considered up when both the 250-day and 125-day Rate-of-Change indicators show positive values. This means that prices are currently higher than they were 12 and 6 months ago.
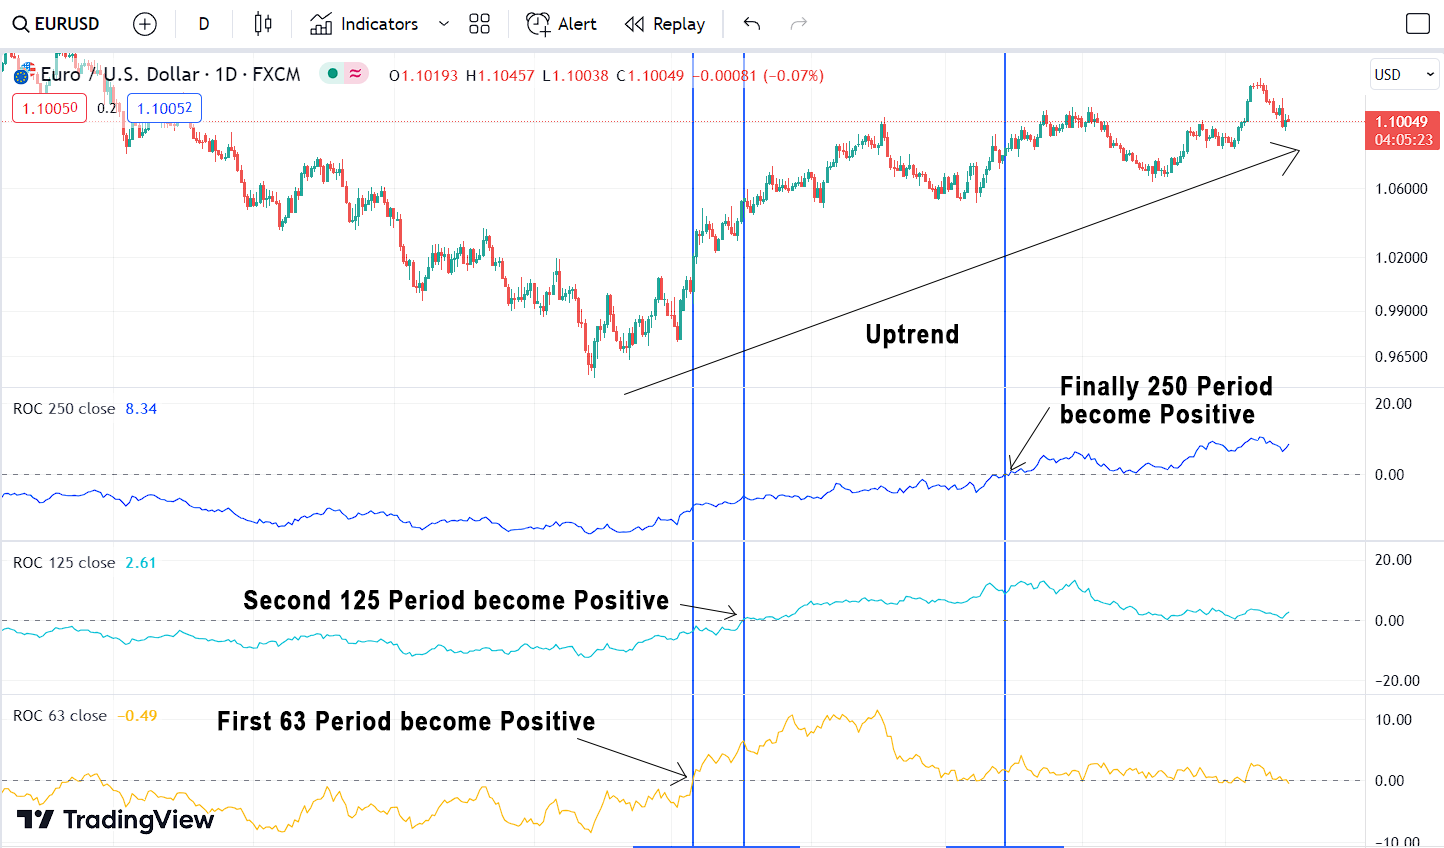
In general, the long-term trend is considered bearish when both the 250-day and 125-day Rate-of-Change indicators display negative values. This indicates that prices are currently lower than they were 12 and 6 months ago, reflecting bearish momentum in the market.
Signals and Trading Strategies:
- Momentum and Trend Confirmation: The primary use of ROC is to confirm the strength of price trends and identify potential reversals. When the ROC value is positive and rising, it suggests that the asset’s price is increasing at an accelerating pace, indicating strong bullish momentum. Conversely, a negative and declining ROC indicates accelerating bearish momentum. Traders can use ROC as a trend-following tool, entering long positions when ROC is positive and short positions when ROC is negative.
- Overbought and Oversold Conditions: ROC can also be employed as an overbought/oversold indicator. When ROC reaches extremely high positive values, it implies that the asset may be overbought, and a price correction or reversal might be imminent. Conversely, when ROC reaches extremely low negative values, it suggests that the asset may be oversold, and a potential bounce-back or reversal could occur. Traders can look for potential buying opportunities in oversold conditions and selling opportunities in overbought conditions.
- Divergence Trading: Divergence occurs when the price of an asset moves in the opposite direction of the ROC indicator. For instance, if the price is making higher highs while the ROC is making lower highs, it signals a bearish divergence and vice versa for bullish divergence. Divergence trading can help traders identify potential trend reversals and make well-timed entry or exit decisions.

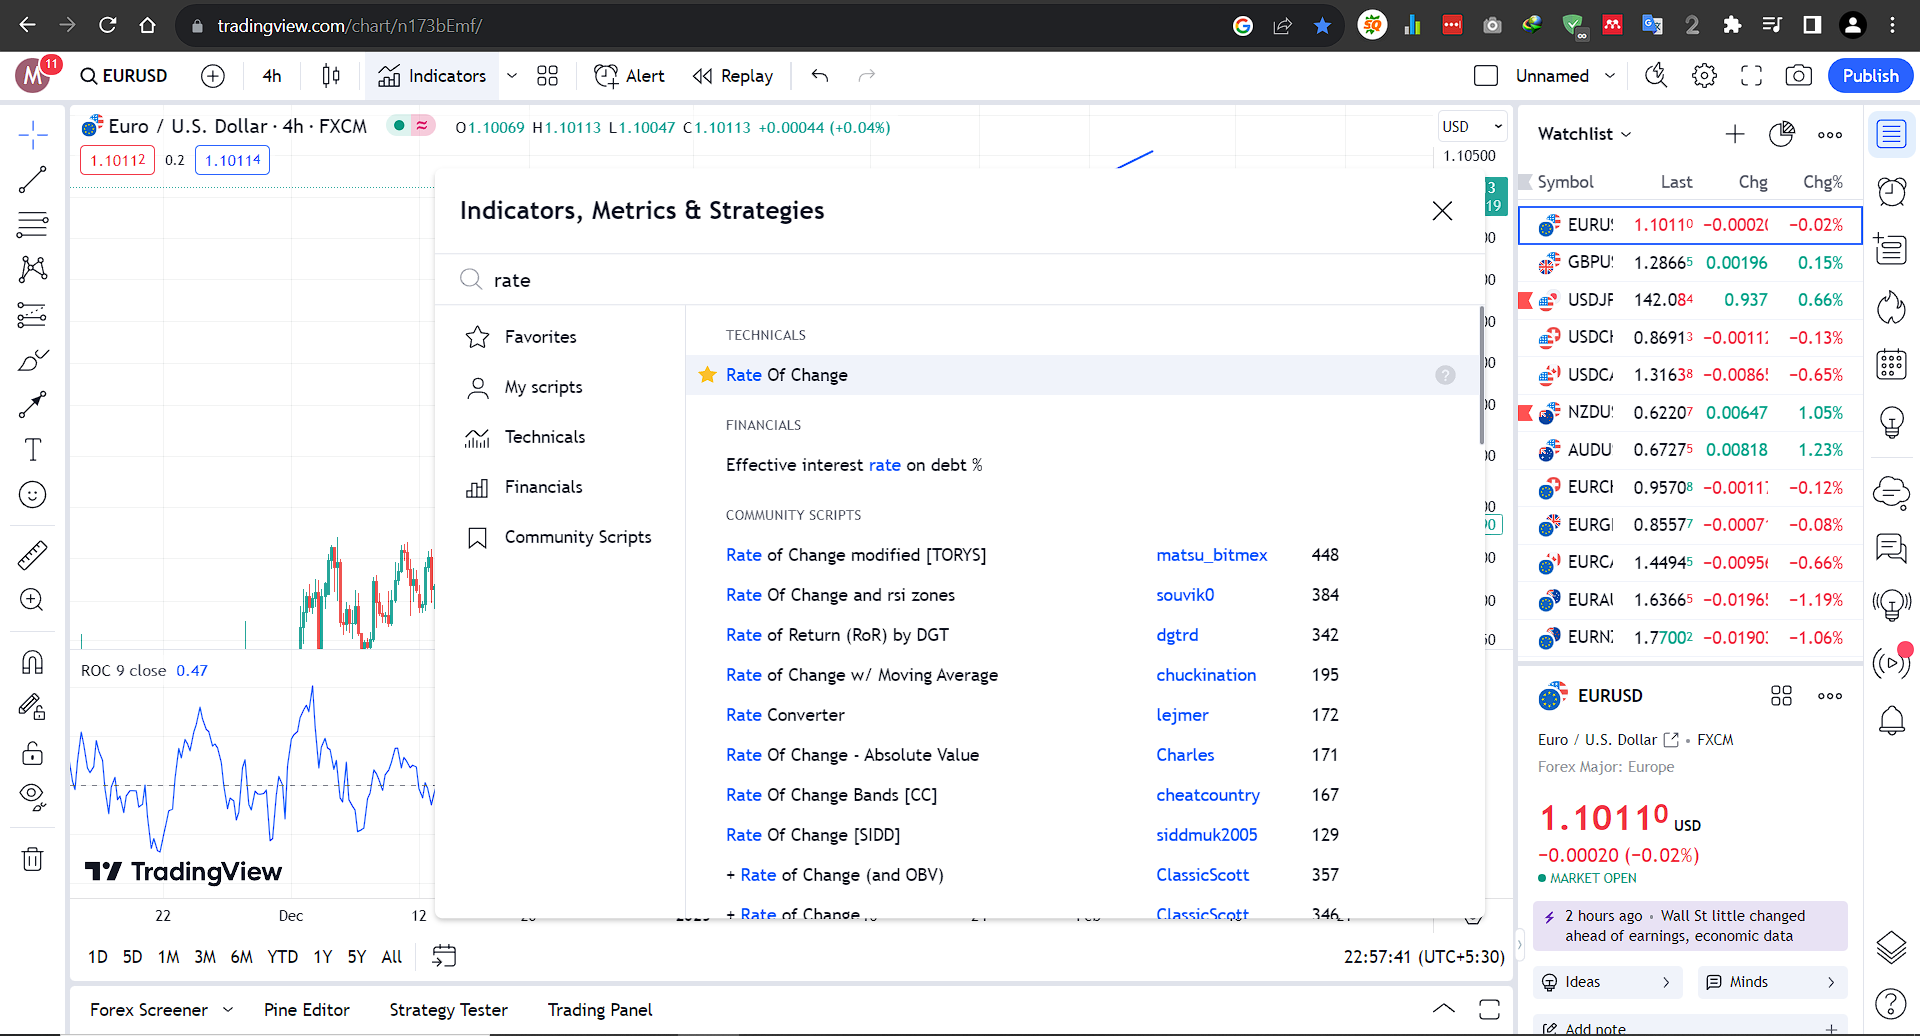
Using Rate of Change Indicator (ROC) with Tradingview:
Goto Indicators, then search for “Rate of Change .” Click on the name of indicator to insert it into chart
Limitations of Rate of Change Indicator (ROC):
- Lagging Indicator: Like many momentum-based oscillators, Rate of Change Indicator is a lagging indicator. It relies on past price data and may not provide real-time signals. Consequently, traders should use ROC in conjunction with other technical indicators or chart patterns to increase the accuracy of their predictions.
- Sensitivity to Parameter Selection: The Rate of Change Indicator’s effectiveness is highly dependent on the chosen number of periods. Different timeframes may yield varying signals. Traders need to carefully select the appropriate timeframe that aligns with their trading style and the asset being analyzed.
Conclusion:
The Rate of Change Indicator (ROC) is a valuable tool for traders to gauge momentum, confirm trends, and identify potential overbought or oversold conditions in the financial markets. While it has its limitations, when used in combination with other technical indicators, ROC can be a valuble tool. As with any trading tool, it is essential to test and adapt ROC to suit individual trading preferences and market conditions, helping traders stay ahead in their investment journeys.
Explore Our Algorithmic Trading Courses: