Introduction to the percentage volume oscillator:
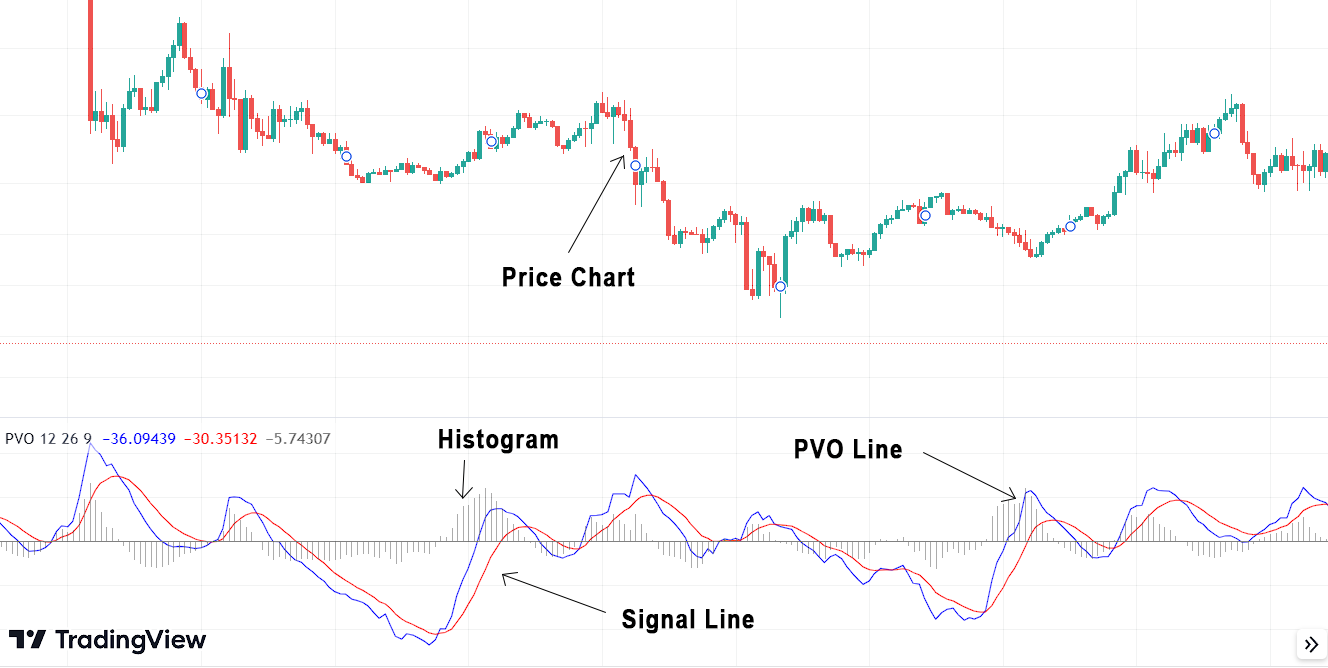
As a momentum oscillator, the Percentage Volume Oscillator (PVO) is calculated using trading volume data. Similar to the MACD, this indicator comprises three key components.
- PVO line
- Signal line
- Histogram
Calculating the Percentage Volume Oscillator (PVO): The Formula:
- PVO Line – The Percentage Volume Oscillator (PVO) is obtained by comparing the 12-day Exponential Moving Average (EMA) and the 26-day EMA of trading volume. The PVO formula is expressed as follows: PVO = [(12-day EMA – 26-day EMA) / 26-day EMA] * 100.
- Signal Line – The Signal line in PVO denotes the 9-period Exponential Moving Average (EMA) of the PVO line. Being a moving average of the PVO, it exhibits smoother behavior and responds more gradually to price fluctuations when compared to the PVO line. The calculation for the Signal line is as follows: Signal line = EMA (PVO,9).
- Histogram – The Histogram in PVO is essentially the variance between the PVO line and the Signal line. It is computed by subtracting the Signal line value from the PVO line value. The formula for the Histogram is: Histogram = PVO line – Signal line.
Interpreting the Percentage Volume Oscillator (PVO):
The Percentage Volume Oscillator generates signals based on crossovers, similar to other technical indicators like the Moving Average Convergence Divergence (MACD). Here’s how to interpret PVO signals:
- Positive PVO (Above Zero): When the PVO is positive, it indicates that the short-term volume moving average is greater than the long-term volume moving average. This suggests increasing buying interest and is considered a bullish signal. Traders may consider entering long positions or holding onto existing ones.
- Negative PVO (Below Zero): Conversely, when the PVO is negative, it implies that the short-term volume moving average is lower than the long-term volume moving average. This signals rising selling pressure and is considered bearish. Traders may contemplate short positions or liquidating existing long positions.
- Crossovers: Just like the MACD, PVO crossovers can provide valuable signals. When the PVO crosses above the zero line, a bullish trend might be emerging. On the other hand, a crossover below the zero line may indicate a potential bearish trend.
Trend Analysis with Percentage Volume Oscillator (PVO):
- When the price of an asset moves in a specific direction, but the accompanying trading volume decreases (PVO values below zero), traders generally view this trend as lacking credibility.
- Conversely, when the price of an asset is trending in a particular direction, and the trading volume increases (PVO values above zero), the trend is considered more legitimate.
- If the price of an asset is consolidating, and the trading volume is on the rise, there is a possibility of a significant price movement in the near future. However, based on volume alone, we cannot determine the direction of this potential price move.
- When trends in either direction become excessively prolonged, the PVO is likely to reverse direction as well. For instance, if a market experiences a rally on low volume, the PVO is expected to accelerate and show a positive (or more positive) value. Conversely, if the market rallies on high volume, once the move loses steam, the PVO is expected to decelerate and show a negative or less positive value.
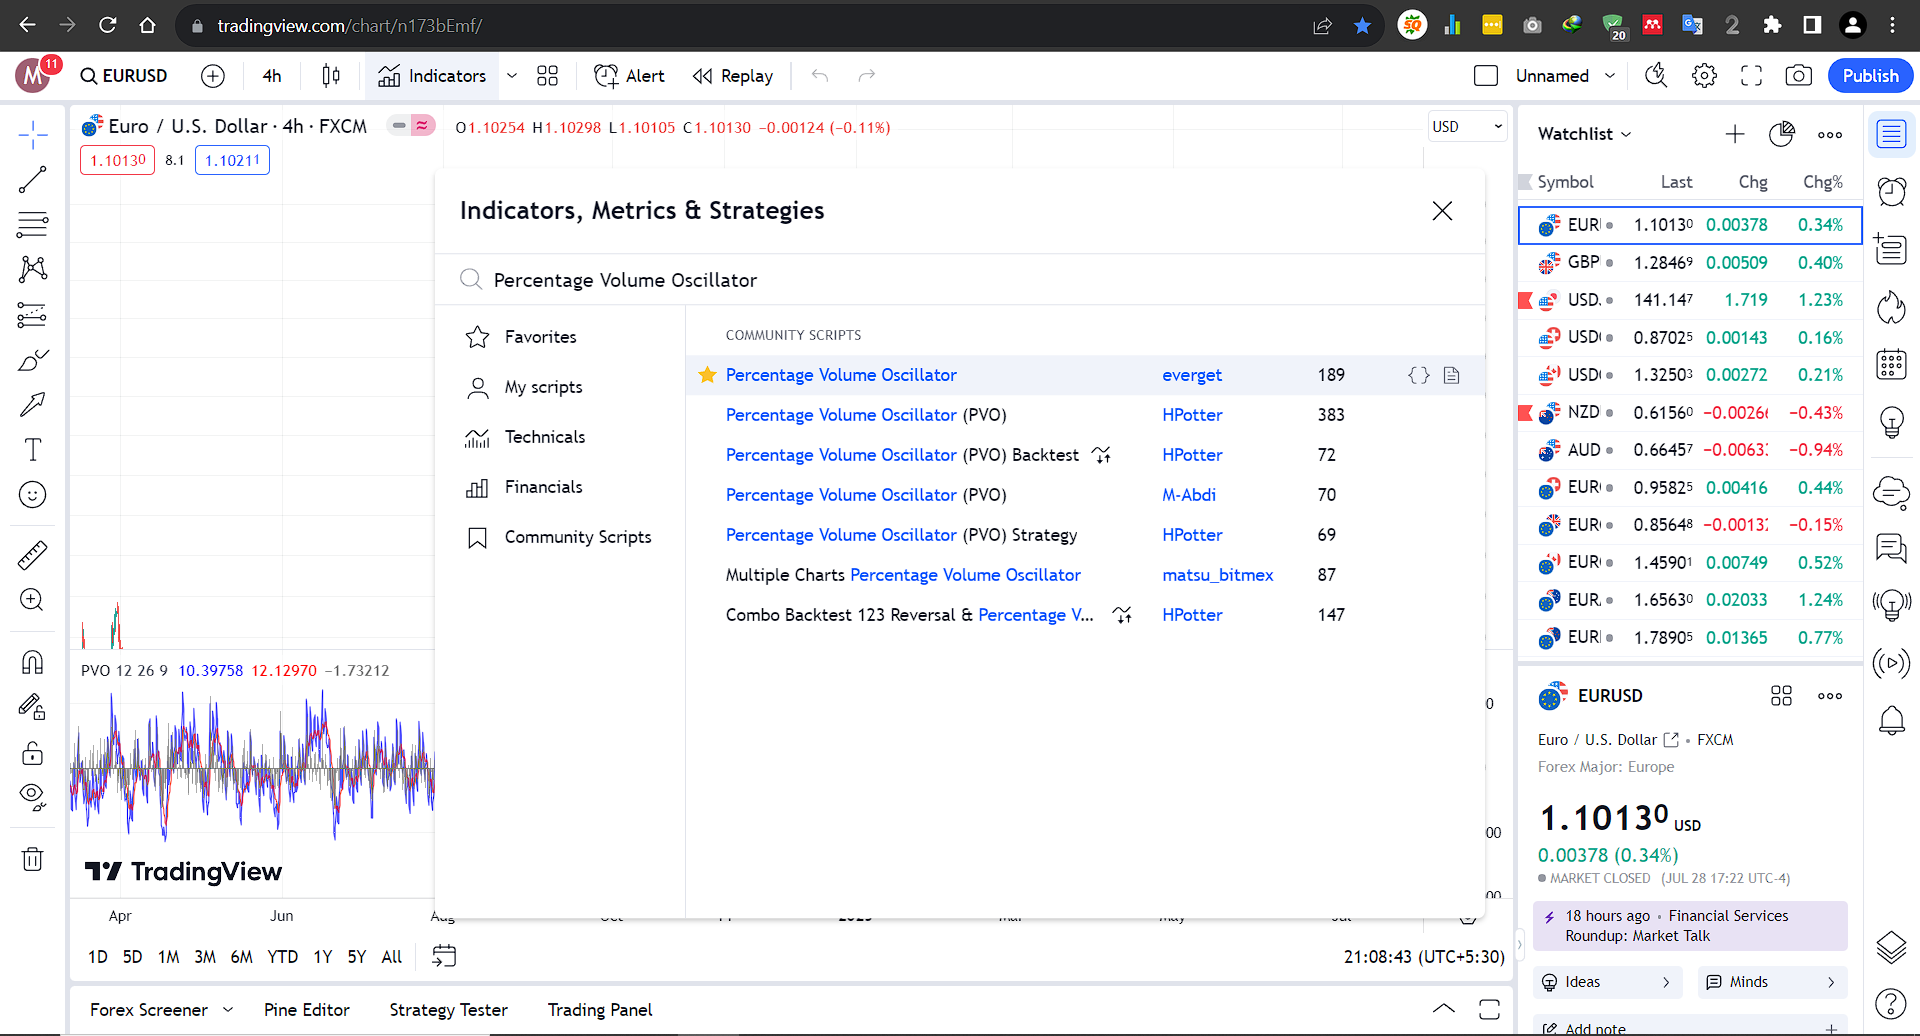
Using Percentage Volume Oscillator (PVO) with Tradingview:
Goto Indicators, then search for “‘Percentage Volume Oscillator.” Click on the name of indicator to insert it into chart
Limitations of the Percentage Volume Oscillator (PVO):
- Lagging Indicator: Like many other momentum-based indicators, the PVO lags the actual price action. Traders should be cautious about delayed signals during rapidly changing market conditions.
- Whipsawing Markets: In choppy or sideways markets, the PVO may generate false signals due to frequent crossovers around the zero line.
Conclusion:
The Percentage Volume Oscillator (PVO) is a powerful technical indicator that combines volume data with price movements to provide valuable insights into market trends. As with any technical indicator, it is essential to use the PVO in conjunction with other tools and conduct thorough analysis before making trading decisions. With proper application, the PVO can be a valuable tool in navigating the financial markets.
Explore Our Algorithmic Trading Courses: