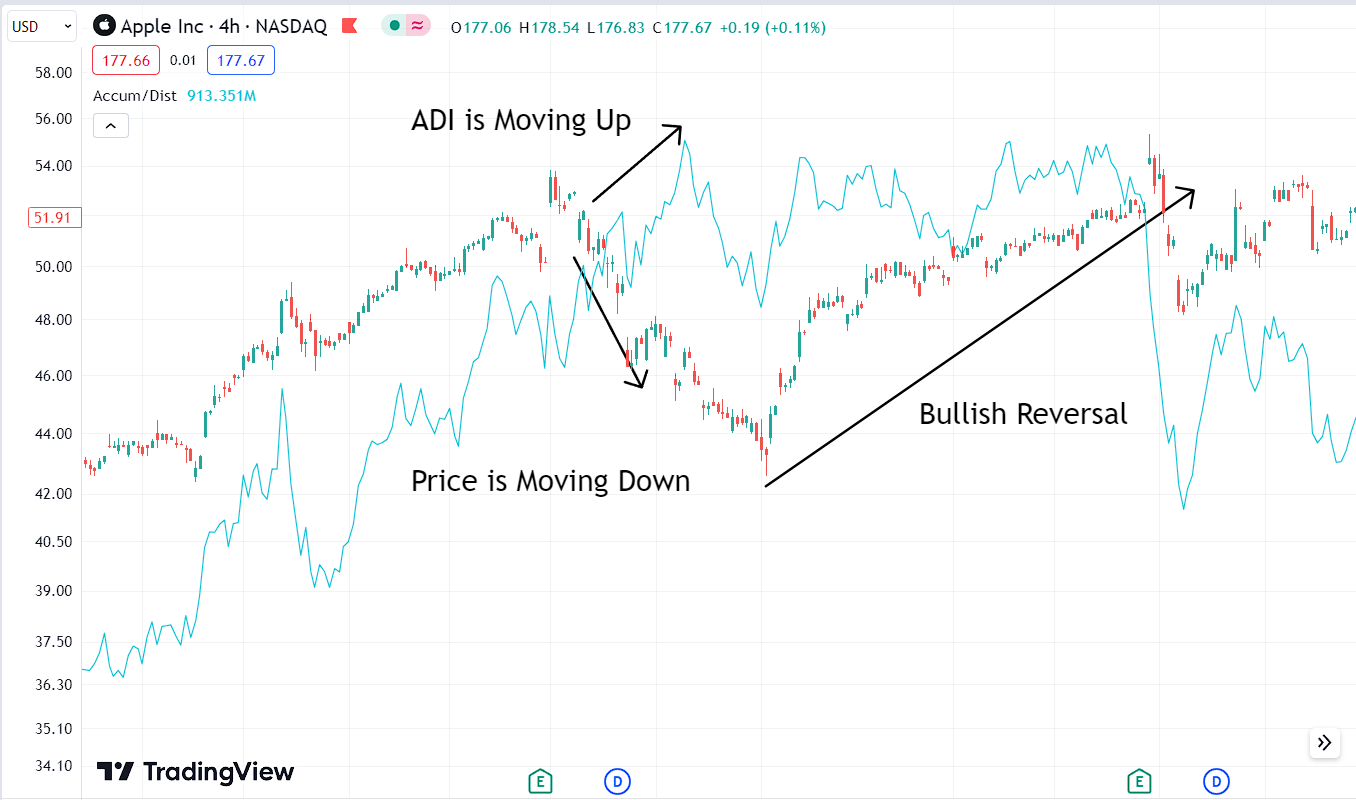
Introduction to Accumulation Distribution Index (ADI):
The Accumulation Distribution Index (ADI), originally known as the Cumulative Money Flow Line, is a single-line indicator that assesses money flow in and out of a security. Developed by Marc Chaikin, ADI falls under volume-based oscillators, aiding traders in understanding buying and selling pressure. By incorporating price and trading volume, ADI quantifies these pressures, facilitating the identification of trends and reversals. It calculates cumulative fund flow, detects price-volume divergences, and signals potential shifts early.

Calculation of the Accumulation Distribution Index – The Formula:
Calculation of the Accumulation Distribution Index (ADI) is as follows:
- Money Flow Multiplier (MF Multiplier) = [(Close – Low) – (High – Close)] / (High – Low)
- Money Flow Volume (MF Volume) = MF Multiplier x Volume
- Accumulation Distribution Line (ADL) = Previous ADL + MF Volume
- Accumulation Distribution Index (ADI) = Moving Average of ADL
Where,
- Close – current closing price.
- High – current high.
- Low – current low.
- Volume – trading volume of the current period
- Previous ADL – ADL value of the previous period
For a more stable and interpretable indicator, ADI values are usually smoothed with a moving average.
Now let us take a look at example –
- Close : $68
- High : $72
- Low : $65
- Volume: 150,000
- Money Flow Multiplier (MF Multiplier): [(Close – Low) – (High – Close)] / (High – Low) = [($68 – $65) – ($72 – $68)] / ($72 – $65) = ($3 – $4) / $7 = -$1 / $7 ≈ -0.1429
- Money Flow Volume (MF Volume): MF Multiplier x Volume ≈ -0.1429 * 150,000 ≈ -21,428.57
- Accumulation Distribution Line (ADL): ADL = Previous ADL + MF Volume ≈ 120,000 – 21,428.57 ≈ 98,571.43 (Let’s assume the previous ADL value is 120,000)
- Calculate Accumulation Distribution Index (ADI): Let’s take the simple moving average of 3 periods. Let’s assume the ADL values over the past 3 periods were: 95,000, 105,000, and 98,571.43. ADI = (95,000 + 105,000 + 98,571.43) / 3 ≈ 99,857.14
Interpreting the Accumulation Distribution Index (ADI):
Interpreting the Accumulation Distribution Index (ADI) involves analyzing cumulative money flow patterns to uncover market sentiment and potential price movements. The ADI combines volume and price data to reveal buying and selling pressures. A solid positive multiplier with high volume indicates robust buying, while a significant negative value with elevated volume suggests intense selling. The ADI’s cumulative line either reinforces or questions the current price trend. This duality helps validate or question trend sustainability.
Notably, divergences between price trends and the ADI offer insights: an upward price trend coupled with a falling ADI may indicate selling pressure and an upcoming bearish reversal. In contrast, a downward price trend alongside a rising ADI could imply growing buying pressure and a potential bullish turnaround. Deciphering these connections empowers traders to anticipate market shifts and make well-informed choices.

Using Accumulation Distribution Index (ADI) with Tradingview:
Goto Indicators, then search for “Accumulation/Distribution” Click on the name of indicator to insert it into chart

Conclusion:
In summary, the Accumulation Distribution Index (ADI) serves as a dynamic tool in technical analysis, blending volume and price data to gauge market sentiment. Its cumulative representation offers a visual insight into buying and selling pressures, which either confirm or challenge prevailing price trends. Through divergence analysis, the ADI aids traders in anticipating potential reversals.
Explore Our Algorithmic Trading Courses:

Cryptocurrency Investing with Python | Earn Passive Income !
Code your own Bot with Python to Automate Crypto Investing in Binance. Upload Him to a Server and He Will Do the Rest !
4.9 Rating
2.5 Hours
1.5K+
$119.99
$13.99

Binance Futures Trading with Python | Build a Market Maker Bot
Unlock the power of automated trading with Binance Futures and Python. Maximize profits with tech & expertise in trading
4.9 Rating
2.5 Hours
1.2K+
$119.99
$13.99

Forex Algorithmic Trading with Python : Build a Grid Bot
Create your own profitable Grid Bot with Python. He can trade many currency pairs at once. With free Bot included !!
4.9 Rating
3 Hours
1.5K+
$119.99
$13.99

Master Forex News Trading with Python | The Secret Strategy
Build an Automated Trading Bot to Capture the Volatility of News Events-with Semi Intelligent Take Profit and Stop Loss
4.9 Rating
2.5 Hours
1.2K+
$119.99
$13.99

Binance Futures Trading with Python | Build a Martingale Bot
Stop wasting time on Paid trading Bots – Create your own Binance Futures Bot and take control of your trading strategy !
4.9 Rating
2.5 Hours
1.5K+
$119.99
$13.99

The Complete Foundation Binance Algorithmic Trading Course
Binance Algorithmic Trading from A-Z | Spot and Futures trading, Build Strategies, Automate with Cloud Server + More
4.9 Rating
4 Hours
1.5K+
$119.99
$13.99

Forex Algorithmic Trading with Python : Build a DCA Bot
Create your own profitable DCA Bot with Python. He can trade many currency pairs at once. With free Bot included !!
4.9 Rating
3 Hours
1.5K+
$119.99
$13.99

The Ultimate Forex Algorithmic Trading Course | Build 5 Bots
Build your own SMA Crossover Bot, Bollinger Bands Trading Bot , Grid Bot, DCA Bot and a Basic Bot to learn Fundamentals
4.9 Rating
4 Hours
1.5K+


